Morty Claim: building an owner verification and onboarding system
My Role
As Director of Product Management for Morty, I served as Project Owner for the development of this system. Working closely with the VP of Engineering, I led the cross-functional team through the end-to-end development process from research through launch and beyond. During the project, I personally conducted product research, oversaw every step of the design and implementation processes, developed the operations Standard Operating Procedures (SOPs), and executed live usability testing.
Problem
Prior to the addition of monetized in-app bookings to the Morty app, the team realized that a prerequisite product state needed to be achieved before such a feature could be developed: verified owners connected to the thousands of escape room businesses that the app offered in its discovery and tracking experience. Up until that point, Morty already possessed the most complete database of escape rooms in the world, but without knowing who the owners of those businesses were, there would be no way to monetize the eventual bookings marketplace.
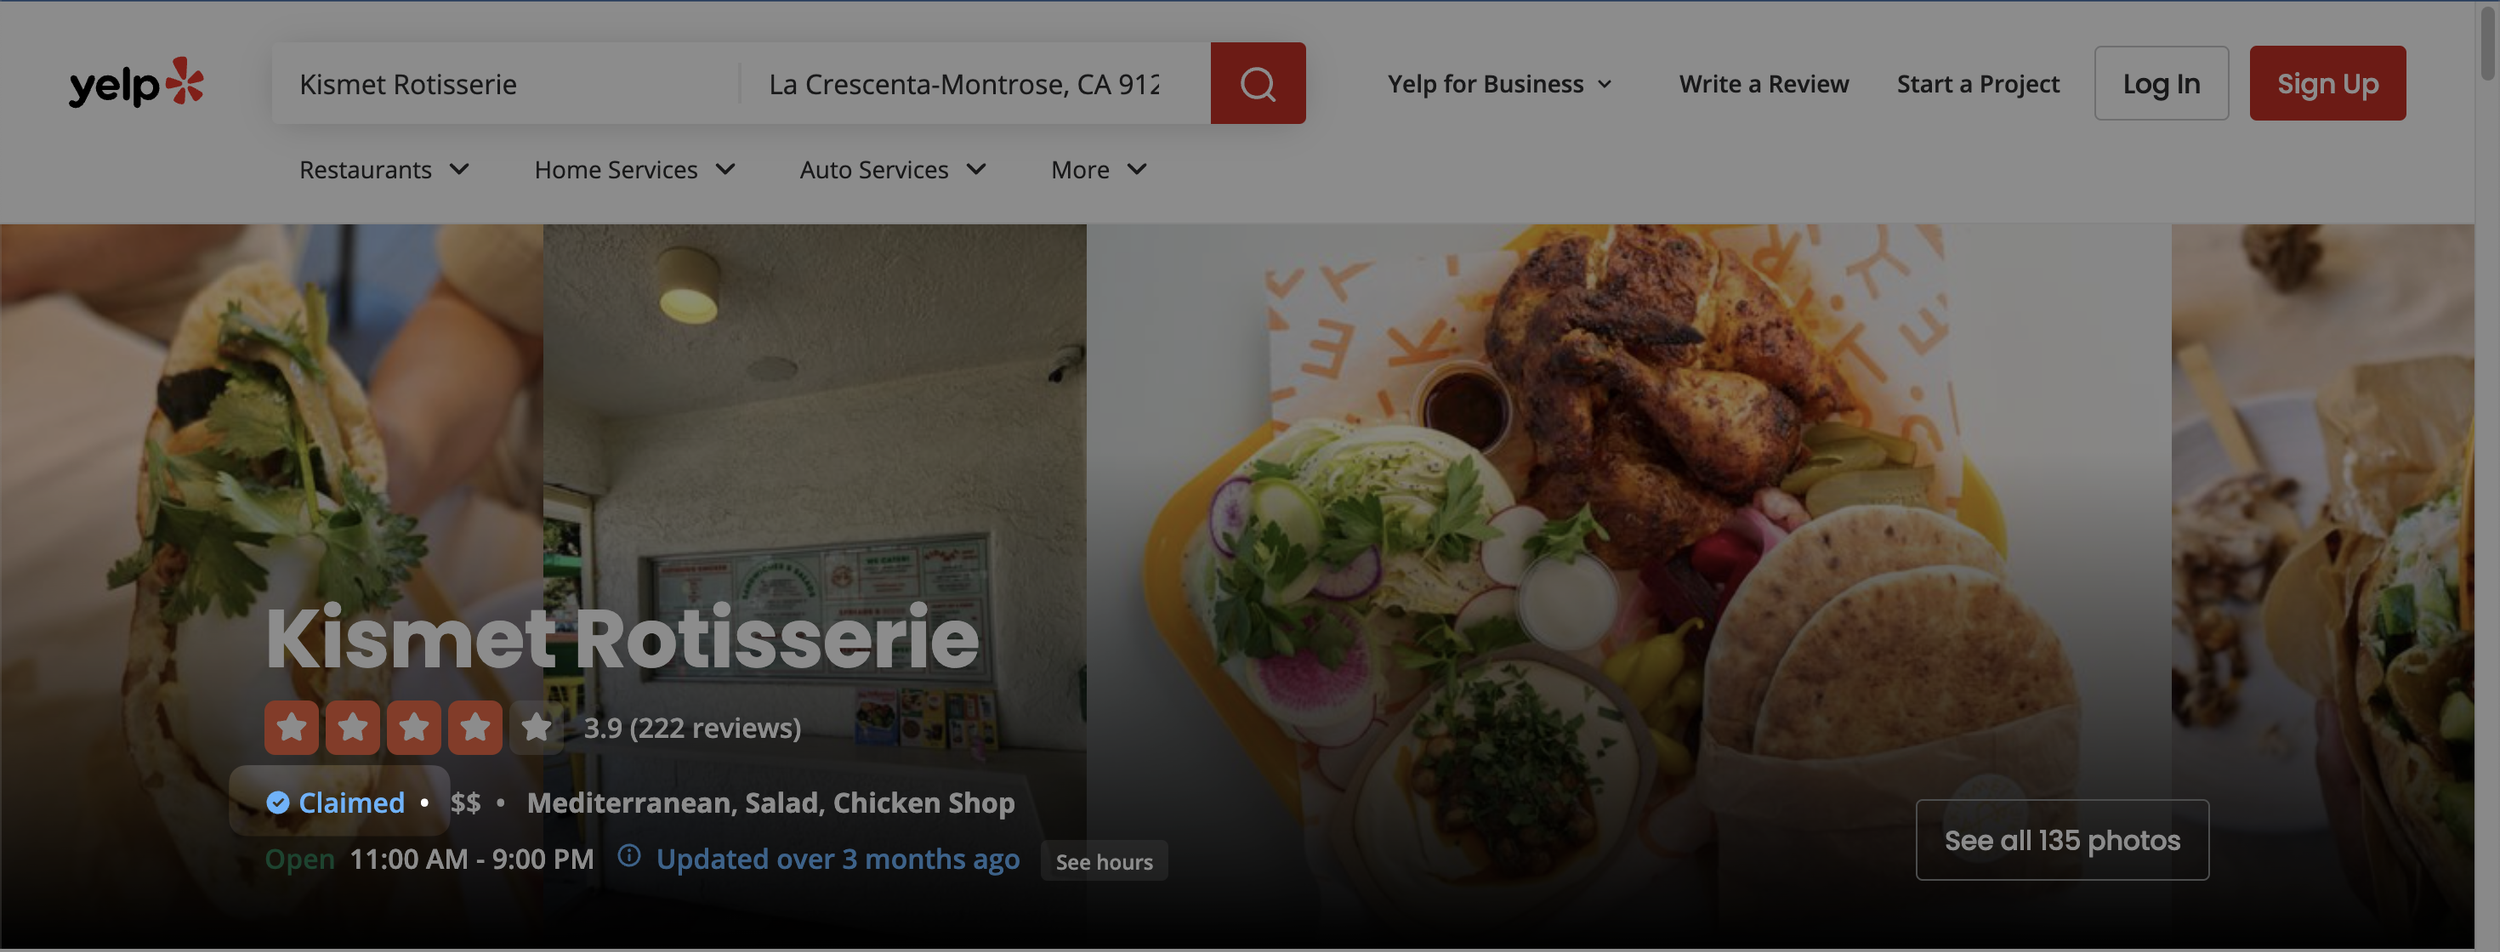
Yelp was a key source of inspiration for this feature. Their Claimed venue widget is highlighted.
opportunities
Owner verification offered other advantages beyond the ability to monetize Morty users booking room through the app; it also made it possible for owners to curate their businesses information and appearance on the platform for the first time. This would make it possible for the team to shift the burden of keeping listings up to date from an internal issue to one that rest with the operators of the businesses themselves, allowing Morty’s data team to focus on more important tasks.
Another key advantage that owner verification made possible was the sharing of valuable data and insights to owners about their businesses. Data, such as, page views, click throughs, customer demographics, and key trends were things we knew owners were interested in and willing to pay for. But, we could only share this information with a person we knew for certain was privy to such knowledge.
project scope
Ensuring the legitimacy of business owners is a crucial step for maintaining trust in online platforms. Our objective was to design and implement a verification process that would be both secure and user-friendly, culminating in the Morty for Business dashboard, a seamless onboarding experience for newly verified owners.
gtm plan
The verification system would be rolled out in a phased approach and follow an expedited version of the team’s typical product process:
Competitive analysis (Inspiration): Review of analogous products to identify the ideal product experience and user flow.
Development of the Claim Flow: A form owners would submit, a process to verify the claim, and a seamless onboarding into the owner dashboard product.
Core product updates: The addition of iconography for claimed and unclaimed locations, along with several entry points into the verification funnel.
Testing
Internal Testing: Q/A to identify any critical flaws before external testing.
Beta Testing: Controlled test among a small group of business owners friendly to the company in a variety of geographical locations.
Wide Rollout: Full-scale deployment, bolstered by several announcement touchpoints, including a personalized email and in-app post.
execution
inspiration
We reviewed a number of competitor products’ verification processes and identified two that were the most seamless and applicable to the problem at hand: Google and Yelp.
Google enables business owners to verify their listing through a phone call or documentation submission.
Yelp allows verification via a phone call or a video showing the business interior and additional ownership proof.
These competitive examples served as useful benchmarks as our team worked to develop a flow that would address our owners’ specific requirements.
Development of a Claim Form and Process
In order to expedite the release of this verification flow, rather than building the entire flow natively, we leveraged Airtable to design a claim form that allowed business owners to submit their verification request. The entries from that form were fed into the associated Airtable database, which was synced with the company’s internal database of escape room venues. This ensured a smoother and more reliable verification processes in that every venue could be easily selected by its respective owner.
After receiving a claim form, a member of the operations team would call the owner at their listed business phone number to confirm they indeed submitted the claim form, rather than a 3rd-party. Following a successful confirmation call, an email would be sent with a link to the business dashboard where the owner could then complete their onboarding and begin managing their business presence in Morty.
Core product updates
Multiple entry points into the claim funnel were added to the Morty app to improve verification rates. A widget was added to every game listing with an Unclaimed ‘badge’ that when tapped, displayed a tooltip and CTA to claim the location. That widget would then update to a Claimed state - a blue checkmark icon - once the venue was successfully claimed.

The left side shows the Unclaimed version of the widget, while the right side shows the Claimed version.
Additional links were added to the menu and any related external touchpoints, including help articles, and marketing pages.
metrics
We identified several key performance indicators (KPIs) that would be measured to assess the effectiveness of the verification flow:
Speed of verification – Average time taken to complete verification (the goal was to verify all claims within 2 business days).
Rate of venue verification – How quickly certain percentages of venues were claimed (1%, 5%, 10%, etc.).
Percentage of unverifiable claims – Cases where claims could not be validated, and documentation of the reasoning.
Deviation from SOPs – Rate at which verification attempts deviated from the defined process, and documentation of the manner of deviation..
Initial usage of the business dashboard post-verification – D30 and D90 retention.
I worked with our data science team to determine baseline expectations for each of these KPIs, which the team later used to assess the success of the flow, post launch.
initial results
Once the full verification process and onboarding flow were in place, we conducted a thorough internal test to reveal any issues or points of inefficiency. Some overlooked onboarding edge cases were caught and addressed, as were a couple of database syncing issues that made it difficult for the ‘owner’ to locate their venues. Engineering cleaned up the bugs and smoothed out the logic to address the edge cases, and the team was ready to move on.
Next, the team conducted a short beta test involving 15 owners who were friendly to the company. This test revealed a few minor issues that were quickly resolved, allowing the team to proceed with the wide rollout.
Key takeaways included:
Several minor adjustments were required to improve clarity and efficiency.
The wide launch was well-received, with nearly 10% of venues in major U.S. metro areas claimed and verified within the first 30 days.
iterations and improvements
Following the initial launch, we identified areas for enhancement:
Issue with the claim form: The form contained a field in which the owner was able to indicate the internal system they used to manage scheduling and reservations. The initial version of the form contained only the 6 most popular systems plus an ‘Other’ option. A far greater proportion of owners than expected - over 20% - selected ‘Other’ when submitting their claim form. To address this problem, the data team gathered an exhaustive list of booking systems and added them as options on the form, reducing the incidence of ‘Other’ to less than 1%.
Claimed icon placement: The icon added to listings of claimed venues was too often not seen by users due to its proximity around other eye-catching UI elements. This was corrected by adjusting the size and placement of the icon to improve its visibility.
SOP refinements improved the accuracy and effectiveness of call scripts based on common owner responses.
results
Speed of verification: The immediate influx of claims following the wide release was more than the team was prepared to handle. Our goal of verifying all claims within 2 business days was not attainable at the outset, with verification time averaging close to 5 business days in the first two weeks following the launch. As the rate of claims slowed, the team was eventually able to adhere to the 2-day goal, averaging 1.4 business days by week 6.
Rate of venue verification: Among venues in major US metros, 1.4% of venue owners submitted claims in the first 24 hours and 9% of venue owners submitted claims in first 30 days. It took just 4.5 months for 20% of venue owners in major US metros to be verified and onboarded into the business dashboard.
Percentage of unverifiable claims: This KPI was less helpful than we originally thought, as most unverified claims were either fake claims (we think usually by people testing out the feature) or due to singular reasons that were not generalizable and useful to improvement. In the first 6 months following the launch, 2-4% of claims went unverified, with no clear pattern identified.
Deviation from SOPs: As alluded to above, deviations were quite common in the first few weeks following release, as operators often had to go off script to answer questions from owners about the company, since most had never interacted with the team so personally before. We gathered the most common questions and used them to created an FAQ that was later included in the claim form submission response email.
Initial usage of the business dashboard post-verification: Among the original cohort of owners who claimed their venues (those in the first week), D30 retention was 31% and D90 was 26%. We were pleased with these numbers, especially when considering the relatively limited features offered on the business dashboard. Although retention in later cohorts was never quite as strong as in this original group.
key takeaways
Product friction is only a problem if the user doesn’t perceive they are receiving a degree of value to justify the inconvenience. This was a feature rife with friction - multiple steps, a tedious form to fill out, days of waiting - yet it was largely successful because owners understood the value they were receiving from claiming their location. Understanding the friction to user value ratio is of the utmost importance when developing a new feature.
Processes involving human-to-human interaction will produce more edge cases than those involving human-to-computer interactions. While people see computers as inherently limited by the bounds of their purpose, they see other people as capable of far greater extension. We had tried to write a verification call script that provided the team member on the call with all the answers they needed. It wasn’t until launch that we learned we hadn’t come close to addressing all the questions that would arise.